Showing posts with label HF. Show all posts

Sunday, December 20, 2020

HF Over-the-horizon radar processing using GNSS timestamped KiwiSDR IQ samples

OTHR parameters: 
  • Chirp repetition time Δt=20 msec
  • frequency slope=1 MHz/sec.
Its bandwidth is 20 kHz which fits nicely into the 20.25 kHz bandwidth of KiwiSDRs in 3-ch mode. 
Instantaneous frequency vs. mod(gpssec, 20 msec)


In the following we use GNSS-timestamped IQ samples for performing bi-static radar processing:
  • Dechirping and framing into 20 msec long GPS-time-aligned frames
  • interpolation in each frame (512 samples/frame)
  • compute the 1st FFT along rows -> relative range
  • compute the 2nd FFT  along columns on the result from the previous steps -> relative Doppler shift
Shown below are maps with relative Doppler frequency vs. relative range for 30 1-minute long periods, i.e., averaged over 1500 chirps each:
  • the main signal comes at two different Doppler shifts and two different ranges, corresponding to two different ionospheric propagation paths.
  • The pattern for the main signal can be found in several other places as well: this should correspond to reflections off some targets where the reflected signal then propagates with similar paths than the main component.
  • It is interesting that besides the main component there are several instances of another pattern present, having two different Doppler shifts and ranges.
  • It might also be that the secondary peaks are artifacts created by the signal processing.
Animation showing relative Doppler frequency vs. relative range.

Wednesday, April 15, 2020

HF TDoA multilateration (2)

This is an update to the last blog post where propagation delays from VOACAP are used in addition to great-circle-derived propagation delays.

As VOACAP provides a number of propagation modes (MODE=25) the mode which is most close to the measured time difference is used.

Note that the findings in the plots below might accidentally: when there are enough closely-spaced delays available it is quite likely to match the data.

Nevertheless it can be seen that large deviation from the hypothesis of ground-wave propagation along great-circle paths are due to different reflection heights, i.e.,  1E-1F2, 2F1-1F2, etc: at a given time, a number of different propagation paths are available, and for different combinations of receivers, different propagation modes are in fact observed.


Comparison of measured time delay differences with differences based on ground-wave propagation along great-circle paths and differences based on VOACAP predictions.

Comparison of measured time delay differences with differences based on ground-wave propagation along great-circle paths and differences based on VOACAP predictions.

Friday, April 10, 2020

HF TDoA multilateration (1)

This blog post contains an analysis of TDoA multilateration applied to signal on 13413.4 kHz using a number of KiwiSDRs located in Europe.

For now the assumption used for making the KiwiSDR TDoA maps is that signals propagate with speed of light along the ground. Here we compare the measured delay differences with the ones obtained from this assumption.

All plots shown in this blog post are generated using octave/matlab .mat files available when using the updated KiwiSDR TDoA algorithm.

The cross-correlations for all combinations of used KiwiSDRs, normalized to have their maximum at unity, are shown below.

cross-correlations

Differences between the measured values and the ones obtained from great-circle-derived time delay differences are due to ionospheric propagation. As expected, the ionospheric effects tend to cancel for pairs of KiwiSDRs which are at about the same distance to the transmitter:

Comparison of  measured with great-circle time differences

The following scatter plot shows the effect of ionospheric propagation w.r.t. great-circle propagation. It will be very interesting to re-do this analysis using propagation delays e.g. from VOACAP instead of assuming propagation along great-circles at ground level.

Scatter plot for time differences

Slightly earlier the plots looked like this:

cross-correlations

Comparison of  measured with great-circle time differences

Scatter plot for time differences


Monday, January 6, 2020

Some HF radar signals

7500 kHz


A number of similar HF radar signals have recently been observed on KiwiSDRs located in Europe on different frequencies.

The pulse repetition rate is 40 Hz (25 ms/pulse).

abs(IQ)

Each pulse consists of a linear chirp and of a pause.

FM demodulation

KiwiSDR TDoA multilateration indicates that these signals come from somewhere in Russia.

KiwiSDR TDoA multilateration

Bursts of what seem to be linear FM chirps have been observed on different frequencies around 8050±~50 kHz.

6390 kHz

Like the signal on 7500 kHz the pulse repetition rate is 40 Hz. However the duty cycle is smaller.

abs(IQ)

FM demodulation


8050 kHz


For this signal, the pulse repetition rate is 96 Hz.

abs(IQ)
Each pulse consists likely of a linear chirp. The spikes in the instantaneous frequency seen below are probably cause by HF propagation effects. Note that these radar-like signals are narrow-band (±1kHz variation in instantaneous frequency, only)

FM demodulation
KiwiSDR TDoA multilateration indicates a position somewhere in the Atlantic Ocean (compatible with the Azores).

KiwiSDR TDoA multilateration

Sunday, September 8, 2019

Chirp sounder measurements with KiwiSDRs (2)

Using the recent work on KiwiSDR waterfall recording (see kiwiclient/kiwiwfrecorder.py) it becomes possible to search for chirp sounder signals in KiwiSDR waterfall data, continuing the topic from this post.

kiwiwfrecorder.py connects both to the 'SND' and the 'W/F' websocket streams. The 'W/F' stream contains sequence numbers for each waterfall line which are used to synchronize the waterfall to the audio data. These sequence numbers can also be used to attach to each waterfall line a corresponding GNSS time tag obtained from the 'SND' stream. As the waterfall data can arrive before or after the audio data, both are combined in a third thread using python Queues for thread-safe communication.

About half an hour of waterfall data was recorded on the AB1LD KiwiSDR using the highest KiwiSDR waterfall speed which turns out to provide waterfall data about for each SND frame, i.e, each 512/12000 seconds. Thanks to the owner for setting up this KiwiSDR and allowing unrestricted access!.

Then the recorded waterfall data (saved in a .npy formatted file) was rebinned in time to 1024/12000 second bins and exported as a .png file. Switching from python to octave, a search for chirp sounders was performed for chirp rates from 80  kHz/s to 130 kHz/sec in steps of 1 kHz/sec: for each chirp rate and for each start time the content of the waterfall bins was summed up along the corresponding line (Hough transform).

Two chirp sounders were found, each having a repetition rate of 720 seconds (12 minutes) with chirp rates of 82 kHz/sec and 100 kHz/sec, respectively. It might be interesting that this list of chirp sounders contains entries for three chirps sounders with 720 second periods located in Norfolk, VA, Kingsville, TX, and in Puerto Rico.

The plots below show zoomed waterfall diagrams around the chirps and on the bottom panel the result of the chirp search, i.e, the sums of waterfall bins along lines with a given slope.


1st chirp sounder detected using the AB1LD KiwiSDR

2nd chirp sounder detected using the AB1LD KiwiSDD

Thursday, July 4, 2019

Talk on KiwiSDR TDoA is available on YouTube

This is just a short note that my recent talk on KiwiSDR TDoA at the Software Defined Radio Academy 2019, which took place during the German Ham Convention in Friedrichshafen, Germany, is now available on YouTube.

For other talks from this meeting see http://youtube.sdra.io/.

Saturday, March 16, 2019

KiwiSDR IQ data streams with >20.25 kHz bandwidth (5)

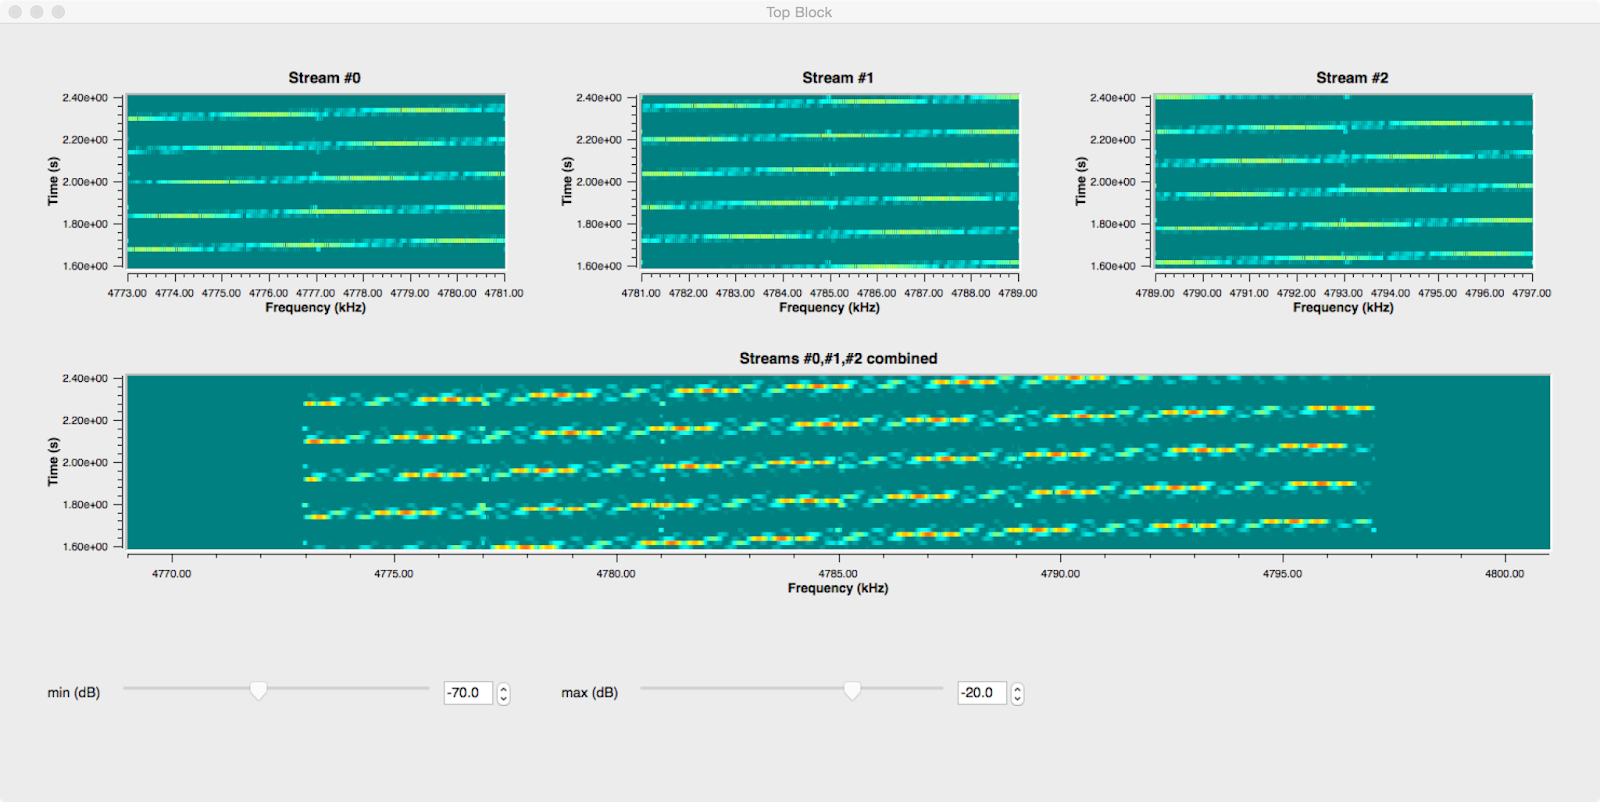
By now, gr-kiwisdr can coherently combine between 2 and 6 IQ data streams recorded from the same KiwiSDR.

Following an idea by WA2ZKD, the following test was made with DRM signals: three data streams were recorded, one centered on the DRM signal on 15120 kHz and two more centered on 15112.5 kHz and on 15127.5 kHz which were then coherently combined into a signal data stream. The GNURadio display is shown below:

Coherent combination of two IQ data streams using gr-kiwisdr.


Both, the WAV file centered on 15120 kHz, and the combined WAV file were successfully decoded by DREAM:

DREAM display

The SNR is comparable for both files, taking into account that it fluctuates by about ±0.5 dB:

DREAM waterfall display for the combined WAV file.

DREAM waterfall display for the WAV file recorded on the center frequency.


Only one slight difference was found in the SNR per carrier display: although the SNR per carrier is fluctuating quite a lot, for the combined WAV file there is a dip around the center which is not there for the WAV file recorded on the center frequency:

DREAM SNR per carrier display display for the combined WAV file.

DREAM SNR per carrier display for the WAV file recorded on the center frequency.

Wednesday, March 6, 2019

KiwiSDR IQ data streams with >20.25 kHz bandwidth (4)

This is a follow-up to this blog post.

The figure below summarizes how three IQ data streams with equal frequency offsets Δf are combined into a single IQ data stream with sampling frequency 4Δf:

Coherent combination of three KiwiSDR IQ streams

Note that the center frequencies are set to exact values, using GNSS timestamps to correct the local KiwiSDR oscillator, while the sampling frequencies of the IQ data streams are derived from the local KiwiSDR oscillator and are not exact. As a consequence the three IQ data streams are not coherent.

The three IQ data streams can be made coherent by 1) correcting for the frequency offsets and 2) aligning the relative phases.

1) Correcting for the frequency offset 

One way of describing this correction is by comparing a signal in stream#1 with frequency ΔF/2  and another signal in stream#2 with frequency -ΔF/2, taking into account that there are two different sampling rates: the true (GNSS aligned) sampling rate Fs and the sampling rate according to the state of the local KiwiSDR oscillator, F′s :
         z1(n) = exp{2πinΔF/2F′s}
         z2(n) = exp{2πinΔF/Fs - 2πinΔF/2F′s} .
The beat offset signal is given by
         z1*(n) z2(n) = exp{2πinΔF(1/Fs - 1/F′s)} ,
and is used to correct for the frequency offset, where F′s is determined from the GNSS time tags in the KiwiSDR IQ streams.

2) Relative phase alignment 

Having corrected the frequency offsets, we are left with constant relative phase differences, Δϕ(0,1) and Δϕ(1,2). These global phase offsets are estimated by cross-correlating the overlapping parts of the spectra, indicated in yellow in the figure above. GNURadio makes it easy to do this, using a combination of freq_xlating_ccf and conjugate__cc and a simple block which estimates the phase difference between two vectors of IQ samples.

Because the overlaps between IQ streams are needed to estimate the phase offsets, recordings with kiwirecorder.py should use the full available bandwidth.

The method described above has been implemented using GNURadio and is available as part of gr-kiwisdr. Please note that this is work in progress and might need further improvements.

As can be seen in the updated GRC flowgraph below, IQ stream sample alignment, the correction for coherence, and the PFB synthesizer were combined into a single GNURadio block, called coh_stream_synth. In addition, exp{iΔϕ(0,1)} and exp{iΔϕ(1,2)} are shown in a constellation diagram display in order to monitor phase coherence (=stable relative phases).

GRC flowgraph

Using the GNURadio PFB synthesizer with 2× oversampling (twox=True), edge effects at the boundaries between IQ data streams are avoided:

Coherent combination of three IQ streams @12 kHz into a single IQ stream @32 kHz.


Tuesday, February 5, 2019

Chirp sounder measurements with KiwiSDRs (1)

The plots below show measurements of the chirp sounders from Cyprus (RAF Aktrotiri). There are two chirps (100kHz/sec) separated by 5 seconds and repeating each 5 minutes. In G3PLX notation they are called 300:240 and 300:245. 

Using GNSS timestamped IQ samples from the KiwiSDR @IU8CRI, tuned to 13,200 kHz, a pair of chirps was analyzed in terms of instantaneous frequency and of propagation time delays obtained from the FFT of the de-chirped signals.

Top: instantaneous frequency; bottom: propagation time delay obtained form the FFT of the de-chirped signal

In this earlier blog post a time offset of about δt=0.3±0.03 msec w.r.t. start time at the beginning of a given UTC second of the chirp signals from Cyprus was found in the chirp monitoring data from the U Twente WebSDR. This offset is also found in the KiwiSDR measurements, i.e., without applying this offset, the first peak in the propagation time delays would be below the equivalent time of propagation along the great-circle distance at the speed of light.

It would be very interesting to implement a more systematic monitoring of chirp sounders using KiwiSDRs.

Tuesday, January 29, 2019

KiwiSDR IQ data streams with >20.25 kHz bandwidth (2)

This is a follow-up on the last blog post. Since then a compensation for the roll-off of the CIC filters in the KiwiSDR FPGA has been implemented in v2.162.

The plot below shows the correction w.r.t. normalized frequency for the 12kHz (20.25kHz) modes in blue (magenta). It is interesting that the main component is in both cases sinc(f)-5 and that the softening of the correction near f=0.5 can be modeled by an exponential function.

KiwiSDR CIC filter compensation
Another improvement w.r.t. before is to use ±4kHz out of the ±6kHz IQ bandwidth in order to avoid alias images from frequencies below and from above, so the GNURadio flow graph looks now like this:
GNURadio flow graph
This flow graph and the code for the KiwiSDR IQ wav file sources and for the stream align block can be found on GitHub (gr-kiwisdr).

In order to verify that the combination of three IQ data streams@8kHz each to an IQ datastream @32kHz does indeed work, two signals were recorded and processed with the above flow graph:
  1.  OTHR signal from Cyprus

    Cyprus OTHR on 14370 kHz @IS0KYB
    As is well-known this signal has a bandwidth of 20kHz and uses a FMCW waveform repeating each 0.02 seconds. When plotting the instantaneous frequency vs. time the FMCW sweeps can be see to be perfectly continuous, i.e., both the alignment of the IQ data streams and the PFB synchronizer work as expected.
    Cyprus OTHR on 14370 kHz @IS0KYB

  2. CODAR WCNA

    The two plots below show a local CODAR signal recorded on a KiwiSDR in Newport, OR. Also in this case the frequency sweeps can be nicely seen. However it is not clear if the second component in the instantaneous frequency having negative slope is due to interference or due to aliasing in the KiwiSDR downconversion processing.

    Local CODAR signal on 4875 kHz @Newport, OR
    Local CODAR signal on 4875 kHz @Newport, OR

The IQ streams used above were recorded using kiwirecorder.py with commands similar to the  following:
./kiwirecorder.py -s sibamanna.duckdns.org,sibamanna.duckdns.org,sibamanna.duckdns.org -p 8073 -f 14362,14370,14378 -m iq -g 55 -w -L -4000 -H +4000 --log-level=info --dt-sec=60 --station=IS0KYB

Tuesday, January 15, 2019

KiwiSDR IQ data streams with >20.25 kHz bandwidth

Recently I got to implement a way of recording data from KiwiSDRs at more than 12 kHz (or 20.25 kHz) by combining streams of IQ data using a polyphase filter bank (PFB) synthesizer. Luckily the two most complicated blocks, the PFB synthesizer and delay blocks, are already available in GNURadio.

What was missing was a block reading KiwiSDR IQ data with GNSS timestamps and a block determining the delays of between the different IQ sources. As all of these come from the same KiwiSDR running the same ADC clock, the offsets are multiples of samples.

For testing I started with a CODAR signal centered around 4820kHz using the AB1BD KiwiSDR. IQ wav files with GNSS timestamps were recorded on 4808, 4820, 4832 kHz, each with 12kHz bandwidth. In order to avoid wrapping around one of the inputs, a PFB synthesizer with 4 channels and 3 inputs was used:

GNURadio flowgraph

The screenshot below shows the three input signals samples with 12kHz and the reconstructed signal @48kHz:
  • Gain vs. frequency for the input signals is not flat. This is a known feature of the KiwiSDR FPGA code (missing CIC filter compensation filters). As a consequence there are dips in the combined spectrum
  • Nevertheless the CODAR sweeps can be seen to be continuous in the combined waterfall display

Top: waterfall diagrams for three IQ streams @12kHz; bottom: combined IQ stream @48kHz


Another test is to look at the instantaneous frequency in the combined IQ data stream @48kHz which looks fine:
Instantaneous frequency vs. time for the combined IQ data @48kHz


Obviously this has more applications than CODAR data analysis, as it opens up the possibility to analyze signals with up to 36kHz bandwidths. When a PFB synthesizer with 6 channels is used, up to 5 KiwiSDR IQ streams can be combined which enlarges the bandwidth to 60 kHz. Instead of using prerecorded wav files, the KiwiSDR GNURadio block can be used to combine streams of IQ samples in realtime.

The code for this will be made available as part of gr-kiwisdr after some cleanup.

Monday, October 22, 2018

KiwiSDR GNURadio block

A first version of a GNURadio interface gr-kiwisdr for the KiwiSDR is available on GitHub. It consists of a GNURadio source block which connects to a given KiwiSDR and provides a stream of IQ samples.

At this moment gr-kiwisdr is not yet complete but fully working. Missing items include support for
  • other modes than IQ mode (not sure if this is really useful)
  • user login and non-default AGC settings
  • stream tags containing GNSS timestamps

For connecting to the KiwiSDR websocket server boost.beast is used. Because the available boost versions, e.g., on Ubuntu, are fairly old and boost.beast is a recent addition to boost, gr-kiwisdr contains git submodules for boost.asio and boost.beast (both are header-only libraries).

Any feed-back is very much welcome.
As an example, the preamble cross-correlation of a STANAG 4285 signal is shown below. The two secondary cross-correlation peaks are there because the 80-symbol long STANAG 4285 preamble consists of repetitions of a 31-bit long pseudo-random sequence generated by a LFSR.

Real-time preamble cross-correlation for a STANAG4285 signal.


GRC flow-graph for the plot shown above.

Thursday, August 23, 2018

New ideas for TDoA multi-lateration

(1) Finding the common propagation mode


Let's consider the case of three receivers receiving the same signal.
  • Each receiver receives the signal at times t1, t2, t3.
  • The cross-correlations produce time differences Δt1,2, Δt1,3, Δt2,3.
  • Trivially, Δt1,2 = Δt1,3 - Δt2,3 (and cyclically) (*)
This situation is illustrated in the plot below.

Common propagation mode


As a second step let's consider the situation when one of the three receivers receives the common signal via two propagation paths, and the cross-correlations to the signals received at the two other receivers have approximately the same magnitude.

Currently the TDoA software performs for each cross-correlation a clustering algorithm, and in the situation shown in the plot below it may well be that the following time differences are obtained: Δt1,2 = -50, Δt1,3 = -100, Δt2,3 = -140. Note that these do not fulfill the identity (*).

Two propagation modes for one receiver

As a consequence, a trivial stage of pre-processing is given by selecting those cross-correlation peaks which are consistent according to (*).

Update 9/22/2018


(2) Using constraints (number of degrees of freedom)


Now let us count the number of degrees of freedom for the case of N receivers receiving the same signal: there are
  • 2 unknowns, (lat,lon), for the most likely position
  • N unknown virtual heights of which only (N-1) are observable in the time differences (adding a common time offset does not change Δti,j)
  • N(N-1)/2 hyperbolæ (=constraints)
Note that instead of virtual heights we might as well add time offsets δtj  to the time differences, Δti,j+δtj, j≠1, and in this way become agnostic w.r.t. the specifics of ionospheric propagation.

As a summary there are N+1 unknowns and N(N-1)/2 constraints:

#receivers #unknowns #constraints #constraints-#unknowns
3 2(pos)+2(δtj, j≠1) 3 hyperbolæ -1
4 2(pos)+3(δtj, j≠1) 6 hyperbolæ 1
N 2(pos)+(N-1)(δtj, j≠1) N(N-1)/2 hyperbolæ N(N-1)/2-N-1

So for 3 receivers there is a 1-dimensional family of solutions while for N≥4 receivers the system of equations is overdetermined.  This sounds good enough to make me suspicious if it is indeed true.


It will be interesting to try these ideas on real data obtained from KiwiSDRs. If anyone spots an error in the logic above please do let me know.


When using N stations there are N-1 independent measurements contained in the time differences δtij, j>i. Two of these are needed to determine the likely position, so N-3 out of the N-1 δti, i≠1, can be found:

#receivers #unknowns #measurements #fixed/total δtj
3 2(pos)+2(δtj, j≠1) 2 time differences 0/2
4 2(pos)+3(δtj, j≠1) 3 time differences 1/3
5 2(pos)+4(δtj, j≠1) 4 time differences 2/4
6 2(pos)+5(δtj, j≠1) 5 time differences 3/5
N 2(pos)+(N-1)(δtj, j≠1) (N-1) time differences (N-3)/(N-1)

Sunday, July 15, 2018

TDoA SuperDARN/Finland

Today signals from the SuperDARN radar in Finland were active around 12375 kHz and the most likely position matches quite well with the known CUTLASS radar position near Hankasalmi.

TDoA maps


TDoA cross correlations


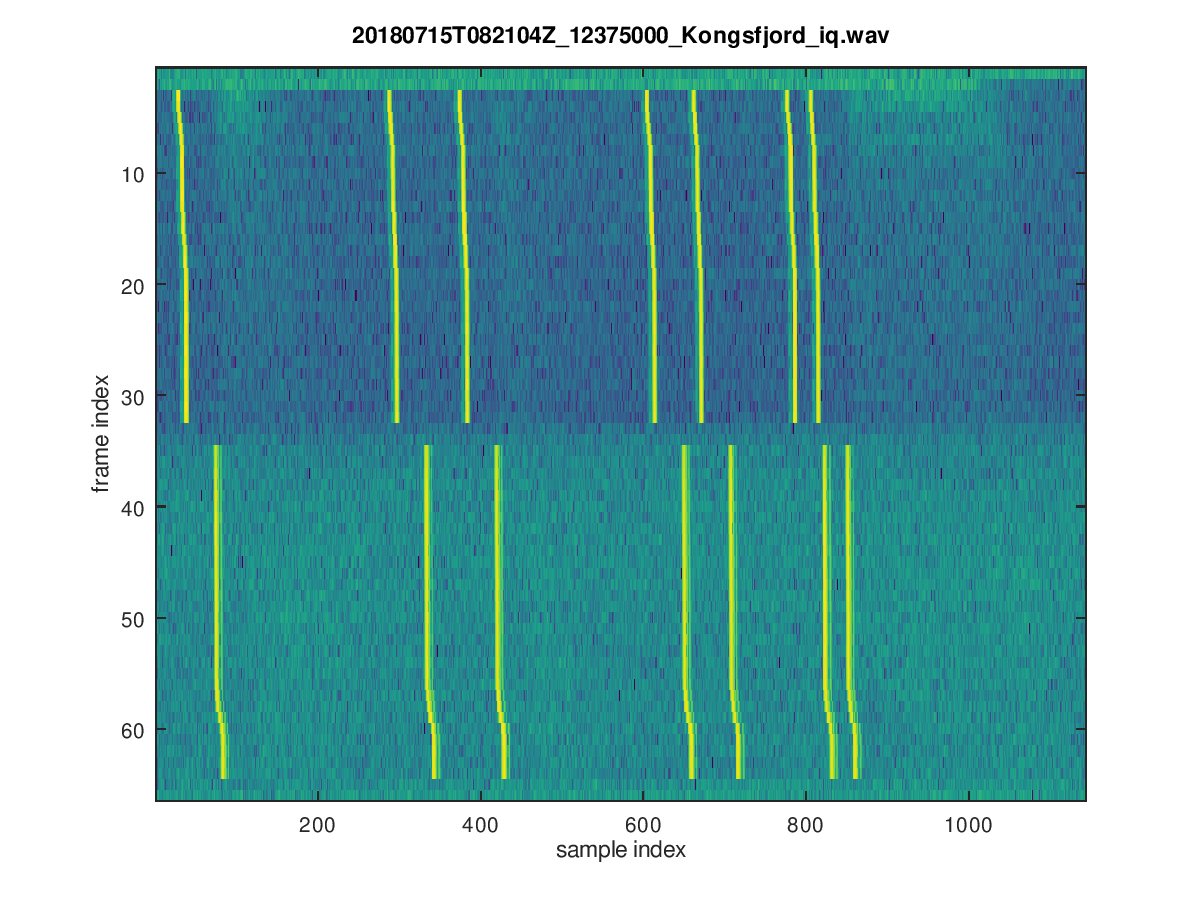
There are pulse trains spaced by integer multiples of 2400 μsec (0,9,12,20,22,26,27), as descibed here:

SuperDARN pulse train

30 of these pulse trains are repeated, approximately each 95.3 msec, then there is a gap of two frames and some delay, and then the next 30 pulse trains follow:

SuperDARN pulse frames

The transmissions seem to repeat each minute with a small gap at the end of the minute.

Another way to verify the used pulse sequence is to compute the autocorrelation of each line of the plot above. All differences between all combinations of the individual pulses show up as peaks in the autocorrelation:
frame number vs. autocorrelation lag

Wednesday, July 11, 2018

Propagation delay maps based on IRI2016 electron density profiles

In order to understand better the propagation delay maps used for this blog post, the animation below was created. References for the used method are arXiv:1104.2248 and this well-known book.

Up to 2-hop propagation is considered. In case there is more than one mode of propagation, the smallest non-ground-wave propagation delay is shown in the maps. If there is no ionospheric reflection, the ground-wave delay is shown.
  • hop=0: no ionospheric reflection -> ground-wave propagation
  • hop=1: one reflection
  • hop=2: two reflections 
Propagation delays based on IRI2016 electron density profiles

Propagation delays based on IRI2016 electron density profiles